Tonight marks the 33rd anniversary of the Great Storm as it started to deepen in the English Channel, moving NE as it did so, creating the strongest windstorm for well over several centuries with the last storm like it being in November 1703. It caused great damage widely throughout the UK with Southern England being hardest hit by these incredibly strong winds, equivalent to a Category 1 hurricane.
It is commonly falsely labeled as a hurricane even though this was something that was much bigger & with far greater strength & destruction in its wake as it powered through the densely populated areas of England.
The Met Office had not thought that such an event would occur that night & only issued a severe weather warning at 01:20 UTC when many were asleep & unaware of the great destruction they would wake up to.

A child playing near a fully uprooted tree on Friday the 16th of October 1987.
It was a storm that caught many forecasters fully off guard due to the fact it was meant to have stayed in the Channel & around Brittany & moving across the northern half of France, clipping the South Coast. The predicted track was like that of seen from Storm Alex a few weeks ago.
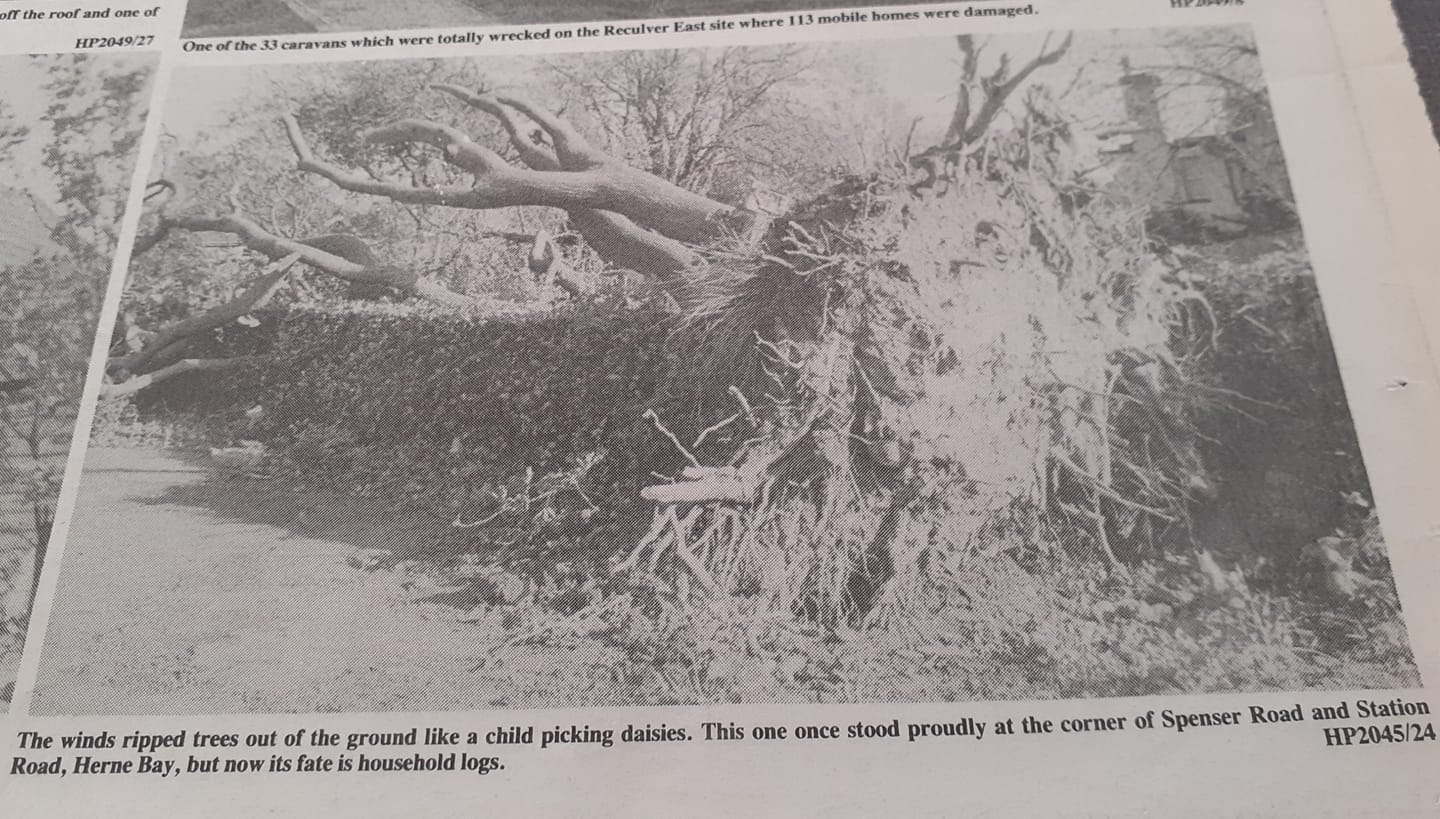
Newspaper photograph from Herne Bay with fully uprooted trees, near the memorial park & train station on the morning of the 16th of October.
The Michael Fish blunder is also widely known across Britain & is mainly associated with this Great Storm with the full forecast from Thursday the 15th of October being available to see below.
‘The Michael Fish effect‘ has been coined where British weatherman are now inclined to forecast the worst possible scenario thereby avoiding the same embarrassment that Michael Fish had during the 1987 storm.
The quiet evening before all hell broke loose
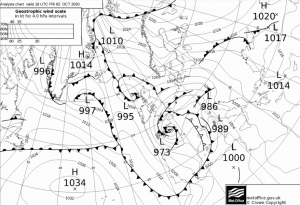
It was a quiet evening for everyone in the South. People didn’t have a clue about what was to come in the next hours that would come to be one of the most costly storms in British history & also the tragedy that was due to come too with 22 people being sadly killed in England & France. The depression was already deepening going from 970 mb at 12:00 UTC to 964 mb at 18:00 UTC, moving NE. The most dramatic deepening wasn’t to be seen just yet.

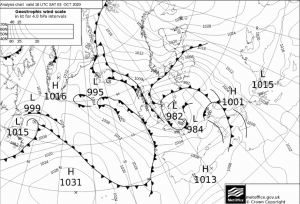
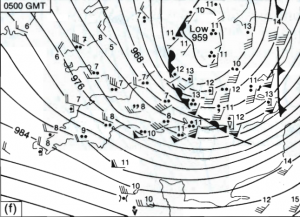
The synoptic analysis map from the Met Office at 18:00 UTC on Thursday the 15th of October 1987.
There was a noticeable warm sector marked along the far SE & into the Channel Islands due to the moving warm sector coinciding with southerly winds from France, starting in the late afternoon of the 15th. This thermal gradient was notable along the North Atlantic with 3°C at Reykjavik at 12:00 UTC & Belfast only reaching 6.4°C as a maximum during the day. Meanwhile, Corunna on Spain’s NW Coast was at 22°C.
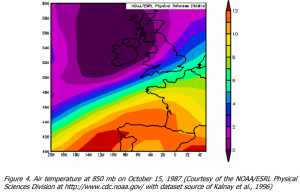
850 hPa (1.5 km) temperatures showing the steep thermal gradient across the North Atlantic on Thursday the 15th of October 1987.
Temperature increases of well over 6°C per hour in a line from places south of Dorset to Norfolk with many places seeing an estimated 1 in 200 year return period for these dramatic temperature increases. Heathrow Airport saw a temperature increase of 7°C within an hour, the highest for at least 37 years.
The most notable has to be from South Farnborough, in Hampshire, in which the temperature rose from 8.5°C to 17.6°C within 20 minutes, as the warm sector moved over this area. At 22:00 UTC, the temperature at Stansted was 8°C and 17°C at Southend-on-Sea, a mere 29 miles between the two spots. It was windy in this warm sector & it started to raise alarm when it wouldn’t stop strengthening.
The pressure then continued to drop & drop & drop & the wind continued to strengthen & strengthen & strengthen.
All hell breaks loose
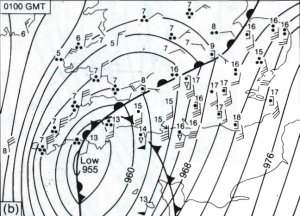
There was a marked strengthening in the wind along a track about 70 km wide that finally reached the Channel Islands around 00:00 UTC with the depression (Low M) now around 953 mb just to the north of Brest, a port city in Brittany as it was slowly moving NE. Rainfall started to spread across the country ahead of the depression & alarm bells were starting to ring at the Met Office. The Met Office released a severe weather warning of Force 11 winds at 01:20 UTC.

Hourly ‘wind and weather’ charts for Southern England at 00:00 UTC with temperature marked in °C & mean wind speed measured in barbs.
You can see the 40-knot mean winds starting to arrive onto the South Coast; these would eventually move NE & strengthen further bringing tremendous devastation widely. Diagram from Burt & Mansfield paper
The depression lay in-between Brittany and Cornwall & the pressure at Chivenor had dropped by 10.2 mb since 21:00 UTC. North or north-westerly gusts blew on the north coast of Cornwall with gusts of well over 70 knots (80.6 mph) at Gwenapp Head.
The night was exceptionally warm in the midst of the winds with 18.0°C at St Catherine’s Head with the winds blowing a southerly for most of Southern England at midnight with a mean of 25 knots (28.8 mph). Brize Norton had a rise from 7°C to 16°C as the warm front passed through at 00:00 UTC.
At 01:00 UTC, the depression lay just off to the south of Plymouth with 957.2 mb being recorded at the barometer there. That was the lowest pressure recorded from any British station during the period of the storm. The wind picked up widely with a mean of 45 knots (51.8 mph) at Culdrose & a mean of 48 knots (55.2 mph) at Portland Bill. Jersey had a mean wind speed of 51 knots (58.7 mph) & gusting up to 81 knots (93.2 mph).
Hourly ‘wind and weather’ charts for Southern England at 01:00 UTC with temperature marked in °C & mean wind speed measured in barbs. Diagram from Burt & Mansfield paper
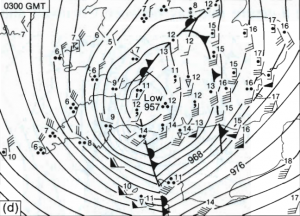
At 02:00 UTC, the depression had crossed the south Devon coast and was centered close to Exeter, standing at about 957 mb. This was the deepest depression to be centered over England for over 150 years.
It is the hour in which winds inland slowly started to turn storm force with gusts of 78 knots (89.8 mph) at Middle Wallop in Hampshire alongside 70-knot (80.6 mph) gusts at Boscombe Down & at Odiham.
The weather station at Jersey recorded a gust of 81 knots (93.2 mph) during this hour as the storm moved further to the NE, giving Jersey the strongest winds with a mean speed of 55 knots (63 mph).
The temperature at Herstmonceux in Sussex had risen to a staggering 17.8°C as winds slowly increased to a mean speed of 43 knots (49.5 mph) during that hour. The continued rise in temperature was due to the winds blowing directly from the south at 190°. The wind direction veered at Plymouth to a north-westerly & the temperature dropped 4°C because of this. Culdrose had a 8.5 mb rise within the hour. Pressure rises of 24 mb were recorded in spots within 3 hours during the storm, an exceptional rise caused by a quick NNE movement, a filling depression & a tremendous pressure gradient.
Hourly ‘wind and weather’ charts for Southern England at 02:00 UTC with temperature marked in °C & mean wind speed measured in barbs. Diagram from Burt & Mansfield paper
At 03:00 UTC, the storm really started to ramp up with the depression now centered over the Somerset levels & mean wind speeds were well into the 30 knots (34.5 mph) range widely all over the entirety of Southern England. Northern France & the coasts of Belgium & Holland were also feeling the brunt of this wind.
To the north of the depression, winds were lighter with 12 knots (13.8 mph) at Yeovilton & a pressure reading of 957.5 mb. Cardiff had the lowest winds with 7 knots (8.1 mph). On the North Devon/Cornwall coasts, there were north-westerly gales of up to 74 knots (85.2 mph) at Gwenapp Head & mean widespread wind speeds of over 40 knots (46 mph).
At Plymouth, the barometer had risen by 9.2 mb within the hour. Lee-on-Solvent, five miles west of Hampshire, had a 65 knot (74.8 mph) mean wind speed. These speeds are equivalent to a Category 1 hurricane. Newhaven had a mean wind speed of 54 knots (62.1 mph) & was gusting up to 73 knots (84 mph). Herstmonceux had a mean wind speed of 54 knots (62.1 mph).
In the Channel, Royal Sovereign Tower Lighthouse had a mean wind speed of 75 knots (86.3 mph) which is equivalent to a high-end Category 1 hurricane. The pressure gradient between Jersey & Guernsey was 6.6 mb between the 40 km that separated them both. Jersey had a mean wind speed of 50 knots (57.3 mph) & gusting up to 74 knots (85 mph). The weather station at Guernsey was gusting even higher with 81 knots (93.2 mph) as a maximum wind gust during the hour with a mean wind speed of 56 knots (64.4 mph).
Central London actually had the highest land wind gust of the hour with a gust of 82 knots at 02:50 UTC; the highest ever seen on record since 1940 alongside a mean wind speed of 44 knots (50.6 mph) at the London Weather Centre.
Power was subsequently shut off near the latter half of the hour until around 09:30 UTC with hundreds of thousands of homes still without power on Friday night.

Hourly ‘wind and weather’ charts for Southern England at 03:00 UTC with temperature marked in °C & mean wind speed measured in barbs. Diagram from Burt & Mansfield paper
At 04:00 UTC, the depression was at the Severn Estuary & was at its worst over a wide area from 04:00 UTC – 05:00 UTC with strong north-westerlies behind the depression that were slowly moving further east. Cardiff had a 21-knot rise in wind speed from 7 knots (8.1 mph) at 03:00 UTC to 28 knots (32.2 mph) at 04:00 UTC.
At Channel Light Vessel, the winds were now at a sustained 70 knots (80.6 mph) being equivalent to a low-end Category 1 hurricane. The pressure at Exeter had risen by 10.6 mb within the hour & Plymouth had a rise of 20.9 mb within 3 hours! The winds were very light around the center of the depression with 7 knots (8.1 mph) at Birmingham & 6 knots (6.9 mph) at Bristol. The gale was at its height across the southeast.
Shoeburyness was recording winds exceeding Force 10 at Shoeburyness in Essex with a mean wind speed of 54 knots (62.1 mph) & gusting up to 100 knots (115.1 mph) before the anemometer failed. Walton-on-Naze in Essex recorded 55 knots (63.3 mph) as the mean wind speed. Odiham in Hampshire had a mean wind speed of 48 knots (55.2 mph). Langdon Bay, on the White Cliffs of Dover, had sustained winds of 62 knots (71.3 mph) & was gusting well over 90 knots (103.6 mph). The weather station at Manston about 20 miles away had a sustained wind speed of 52 knots (59.8 mph) & gusting up to 86.5 knots (99.5 mph).
Portland Royal Naval Station had a sustained wind speed of 55 knots (63.3 mph) & was gusting up to 75 knots (86.3 mph). St Catherine’s Point had a sustained wind speed of 56 knots (64.4 mph) & was gusting up to 90 knots (103.6 mph). Herstmonceux had a sustained wind speed of 58 knots (66.7 mph) with gusts up to 83 knots (95.5 mph).
Winds were gusting well over 45 knots around all the depression except for the northern half where winds were reasonably calm compared to the south getting well over 90 mph gusts consistently.

Hourly ‘wind and weather’ charts for Southern England at 04:00 UTC with temperature marked in °C & mean wind speed measured in barbs. Diagram from Burt & Mansfield paper
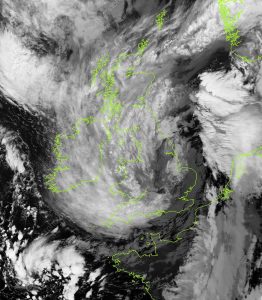
This image was obtained at 04:42 UTC on 16 October 1987 by the advanced very-high-resolution radiometer (AVHRR) on a NOAA (National Oceanic and Atmospheric Administration) weather satellite.
At 05:00 UTC, the depression was centered between Leicester & Peterborough with an occluded front sweeping across Southern England with a marked temperature drop around 5°C behind it. The pressure had risen by 12.2 mb at Hurn & 11.0 mb at Southampton Weather Centre within the hour & both had a drop of 6°C with a SW’ly wind. The highest winds at 05:00 UTC were in Essex, Kent, Sussex & Dorset. Manston was at a sustained 50 knots (57.3 mph) & gusting up to 78 knots (89.8 mph). Shoeburyness was at a sustained 55 knots (63.3 mph) & gusting up to 83 knots (95.5 mph). Herstmonceux was at a sustained 60 knots (69 mph) & gusting up to 88 knots (101.3 mph). Gatwick Airport had to close after a gust of 86 knots (99 mph) was recorded.
Hourly ‘wind and weather’ charts for Southern England at 05:00 UTC with temperature marked in °C & mean wind speed measured in barbs. Diagram from Burt & Mansfield paper
At 06:00 UTC, the depression was just to the north of Hull & winds in the southeast were still going with Manston still having a sustained wind speed at 51 knots (58.7 mph) gusting to 84 knots (96.7 mph). Shoeburyness was gusting to 78 knots (89.8 mph) & Herstmonceux was still gusting to 90 knots (103.6 mph).
The disruption to stations was so bad that Manston was the only station being able to be plotted on the original 06:00 UTC working map within a 120 km circle centered on the Thames Estuary with the nearest plot being in Birmingham. Many stations relied on mains power so valuable data was lost during these hours with power off. This is why many suggest the readings taken from stations are far underestimating the actual wind gusts that occurred.
Very large 3-hour pressure rises were also seen with Portland RNAS rising 25.5 mb from 03:00 – 06:00 UTC & Yeovilton rising 23.6 mb during the same period. The worst however was now over & people started to pick up the pieces as they awoke from their slumbers.

Maximum wind gusts from a variety of stations in Southern England from the night of the 15/16th October 1987. Diagram from Burt & Mansfield paper
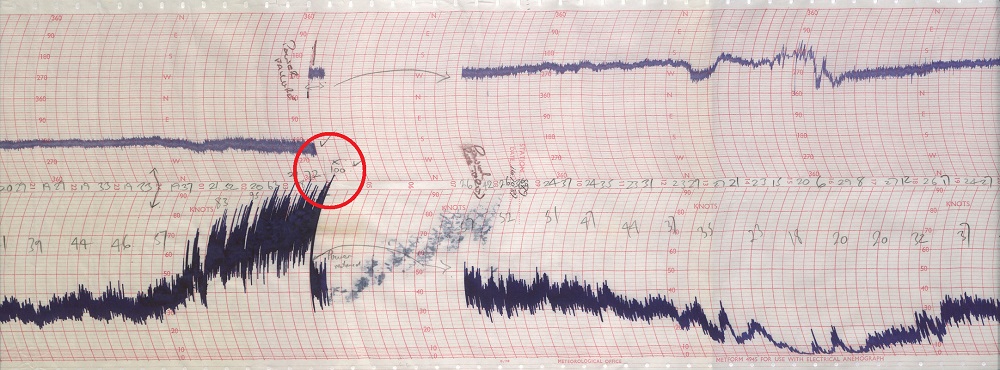
Anemograph showing the maximum 100-knot wind gust at Shoreham-on-Sea before a power cut at 03:10 UTC. This was the strongest wind gust recorded during the Great Storm here in the UK.
The maximum wind gusts were like never seen before on observational history. Winds like these were not so far away from happening again in which there was the Burns’ Day Storm of the 25th of January 1990, causing widespread damage & some incredibly strong winds. This time people actually had been warned of it but the damage was still immense.
Many observers of the storm during the night also reported a strangely high amount of flashes of lightning with Hurn, Honington & Wattisham all reporting lightning in the early hours. This could be another reason why the wind gusts were so high in spots but it could also be that these were just simply power flashes from failing power lines.
Eyewitness accounts during the storm
I remember the day as if it was yesterday. I was living in Ramsgate and was a sergeant with kent police. I walked to ramsgate Police station about 5am that morning, there were entire roofs of houses deposited on the roads, and it seemed like the world was coming to an end. The winds were something I had never experienced before. The chimney at the Police Station had collapsed through the roof. We carried out many rescues that day, together with the other emergency services. I have never experienced anything like it since.
Dave Martin (Ramsgate, Kent)
At home in Herne Bay, as the wind increased I became concerned about the security of my new garage door which was simply leaning against the side of the garage, waiting to be installed. As I approached the door, the wind took control and a huge gust sent it flying across the garden, all 8’x 9′ of it. My wife and I managed to drag it back to a more sheltered spot, but it was obvious that we had to fix it somehow, so out came the hammer drill. In the screaming wind and bits of roofs and trees falling all around us, I rawlplugged some anchors into the wall and safely lashed the garage door down with string. The night sky was now lit by flashes from the nearby electricity pylons and the noise of the storm was deafening. A neighbour’s double glazed lounge window was smashed on the outside pane and he spent the rest of the night pressing the remaining inside pane to contain it’s flexing. He won. Caravans at a local site were badly affected, some of them were thrown upside down. Thankfully nobody was harmed and our own loss amounted to a single ridge tile blown away. It was replaced by a professional neighbour for a small sum, but I recall the sudden abundance of ‘roofers’, their saloon cars sporting roof racks and ladders, coming out of the woodwork. Where are they now? Retired and/or still on the dole? An unforgetable night that had to be seen to be believed!
Harry (Herne Bay, Kent)
I clearly remember this day and night. I woke up in my flat in Herne Bay, I had heard the storm during the night with falling tiles and smashed glass. I walked to work that morning and it was like a large bomb had been dropped on my town. Trees were all over the road walls had been blown down and roofs had been opened up. As I got nearer to work at Wachers builders merchant I walked past Herne Bay railway station and saw part of the large corrugated roof of my workplace. It had blown straight over the station and landed in the street some 200 meters from the building. It was only good fortune that it did not kill anybody and happened at night. Wachers had only moved into the new building some two months before.
Paul (Herne Bay, Kent)

A newspaper photograph from the 1987 storm in Herne Bay, showing a ripped apart shelter on the seafront.
The aftermath
Damage caused by the Great Storm was estimated at well over £1 billion with the insurance industry being totally unprepared for a storm of this magnitude to hit the UK unannounced. Communication with insurance companies was virtually impossible due to the lack of phone lines still up & the fact they were only open 9 – 5.
One in six households in South-Eastern England made insurance claims after the October 1987 storm hit with 1.3 million reported damage incidents reported by the Building Research Establishment.
A photograph of a car destroyed by a fallen tree taken on Friday the 16th of October 1987.
It was one of the first financial catastrophes of the ‘modern era’ & contributed to the ‘Black Monday’ stock market crash on Monday the 19th of October with many people panic selling their stocks & having the second-largest decline in stock market history due to stocks having to shut on Friday the 16th of October.

FTSE 100 Index of the London Stock Exchange (19/06/1987 – 19/01/1988)
Schools, shops & businesses had to all shut as the storm had carved a path of destruction right through the southern half of the UK. Thousands of roads were blocked along with railway lines closed. It was a day of staying put unless absolutely necessary with disastrous sea conditions with hundreds of boats being washed away during the night.

A newspaper photograph from Hillborough on the outskirts of Herne Bay with a farm shop completely flattened.
Dover’s port was closed for the first time in history with 22 people having to be saved from a Sealink boat (Hengist) as it ran aground in Folkestone. A woman was killed in Chatham as a tree fell through her house; a motorist died when his car hit a tree in Detling Hill. A man in Biddenden had two chimney stacks fall through his roof & his house collapsed, killing him. 90% of the county’s roads were impassable. Two leopards escaped from Howletts, near Canterbury & a row of cottages in nearby Tyler Hill was blown down. There are many more incidents like this spread widely across the south.
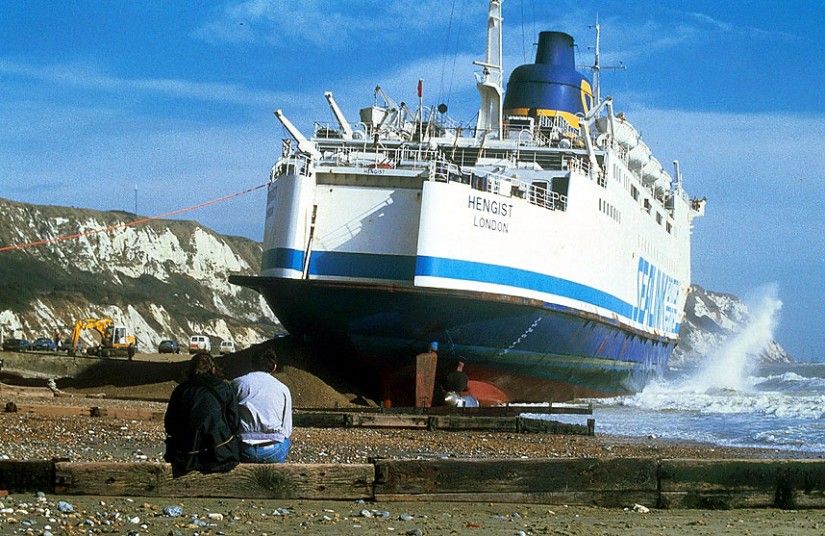
A photograph of Sealink ‘Hengist’ grounded at Folkestone on Friday the 16th of October 1987.
Six of seven eponymous oaks at Sevenoaks were destroyed in the storm. An estimated 15 million trees were downed during this storm with well over 3.9 million cubic meters of forestry completely destroyed in SE England because of the strong winds & the fact leaves still had not fully fallen off trees yet, making them more vulnerable. The damage to trees & forestry was phenomenal.
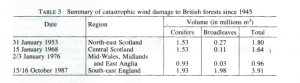
Table of the wind damage to forestry across the UK from 1945 – 1987 storms. Table from the Burt & Mansfield paper.
The damage was also added on when there was above average thunderstorms for the rest of the month with some happening on the 20th of October, further adding to the misery of it all.
What caused this?
The jet stream was a lot further south than usual with it sat over Northern France compared to its usual location just to the north of Scotland. This then brought the UK into the heart of low-pressure systems with the jetstream going right over the south of the UK & London.
There was also a dramatic difference in tropical air from Spain & very cold polar air from the Atlantic colliding, creating a very deep low-pressure system. This was noted in observations at 00:00 UTC with Manston at 17°C & Cambourne at 7°C. This helped cause a rapid descent & the system had deepened to around 953 mb in the English Channel. Pressure also rose rapidly to the west of the storm, creating strong wind gusts as the atmosphere tries to even it all out.
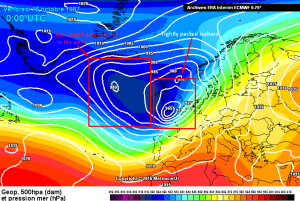
ECMWF Reanalysis of Friday the 16th of October 1987 at 00:00 UTC.
The bigger the difference between the high & the low pressure – the higher the flow of air is & this big difference led to the hurricane-force winds that we saw during the course of that night.
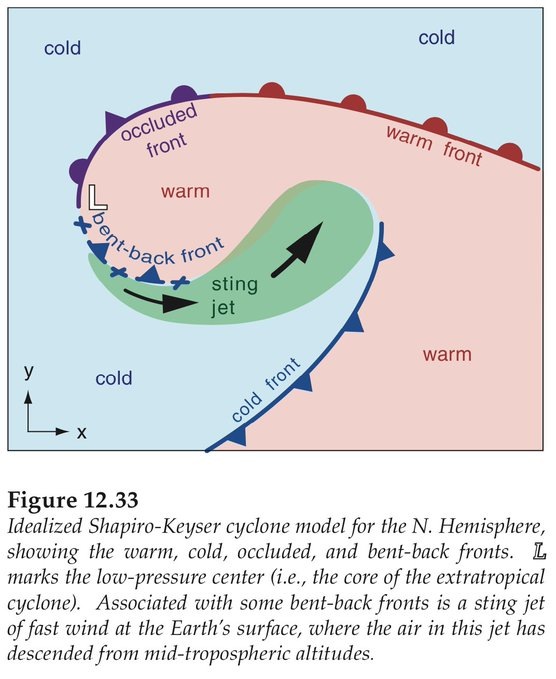
There was also the discovery of a sting-jet during the Great Storm which was a narrow current of air that rapidly descends to the surface & can create winds of well over 100 mph with a swath less than 100 km across.

This was the lead cause of some of the many intense wind gusts from the storm which caused tremendous damage across the entirety of Southern England.

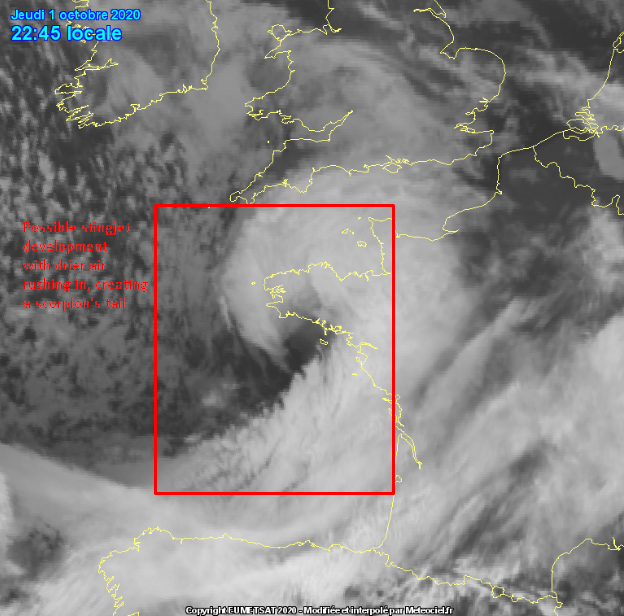
Met-2, 15 Oct 11:00 UTC – 16 Oct 03:00 UTC MVIRI, Water Vapour
You can see below the dry intrusion rushing into the storm with a cloud head forming & the mini scorpion tail being just visible.

Met-2, 16 Oct 00:00 UTC MVIRI, Infrared
What lessons were learned from this?
The Great Storm was a game-changer in UK meteorology & it led to changes in the way forecasters dealt with extreme weather & helped numerous advances in the science of meteorology & numerical weather prediction. The warning system from the Met Office had a total overhaul with warnings now being able to be issued in advance & not during the actual weather event itself.
This further had an overhaul in 2011 with the new matrix warning system being issued that we all know today with warnings for fog, rain, snow, etc. More ships with weather equipment also allowed further observational data & further allowed storms to be predicted accurately & with more of an advanced warning. This was the case with the Burns’ Day Storm of January 1990, in which a Russian ship measured an immense drop in pressure in the center of it.
This matrix system has been very effective in warning the public about these windstorms but it does have its many strains that people have debated in whether the impact-based system is truly the best way forward with warning.
Supercomputer technology has also hugely advanced since 1987 with models back then using 150 km grid squares for weather predictions, which is now down to 1.5 km with greatly increased forecast accuracy & model accuracy. The computers back then could only perform 4 million calculations a second whilst now they can perform well over 14,000 trillion calculations per second. This helps to save lives & also lets us unlock new science & a greater understanding of our weather.

Newspaper photo from Reculver, near Herne Bay, with a completely wrecked caravan shown with 113 mobile homes being damaged & 33 being completely destroyed on the Reculver East site.
Conclusion
In conclusion, this was a Great Storm that caused great damage & left a mark on all of Britain & will certainly never be forgotten for the rest of history. A storm of similar strength was to be seen 3 years later with the Burns’ Day Storm of the 25th of January 1990. Greater preparation & forecasting did lead to less damage but more lives were sadly lost due to the daytime hit.
The storm also led to greater developments in meteorology & we would be further behind in our knowledge of storms without it. The Burns’ Day Storm would also have been more of a great tragedy without the prior knowledge of the storm 3 years earlier. The next big storm is only around the corner & could happen any year but we are more prepared than ever for it, partly due to storms of the past, such as the Great Storm of 1987.
You never know, the next big storm could be here within the next months.
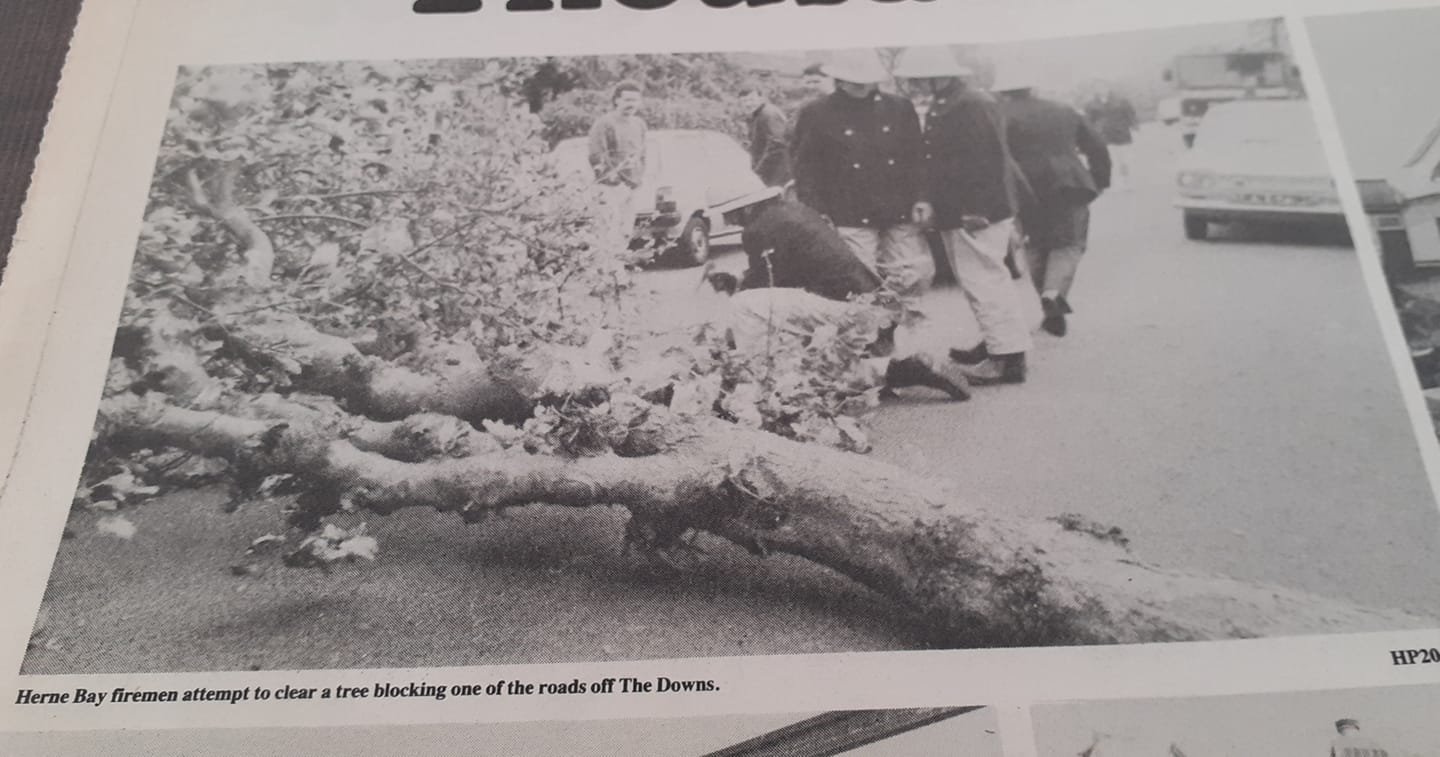
Newspaper photograph from Herne Bay with firemen attempting to clear a tree blocking one of the roads near the Downs.
Have a good rest of your week everyone!
Jamie
—————————————————————————————————————————————————-
Sources of information/charts
Burt, S.D., and Mansfield, D.A., 1988. “Great Storm of 15–16 October 1987.”
Bob Prichard – 2012. “The Great Storm of 16 October 1987”
The Great Storm of 1987 – a 20-year retrospective – RMetS – 2007.
Eyewitness accounts – BBC Kent
1987 storm: How the chaos contributed to Black Monday financial crisis